PowerBI Visualizations
My Hemoglobin & Iron Levels
In July, 2022, I ended up hospitalized after a collapse. We quickly diagnosed a blood issue but only in early 2023 discovered that it was Iron Deficiency Anemia.
Since then, I've had 4 blood transfusions and 2 iron infusions. I also get blood work done regularly.
I thought it would make a good project to visualize my hemoglobin and iron levels over time so I decided to compile my own records as CSV files and do it using Power BI.
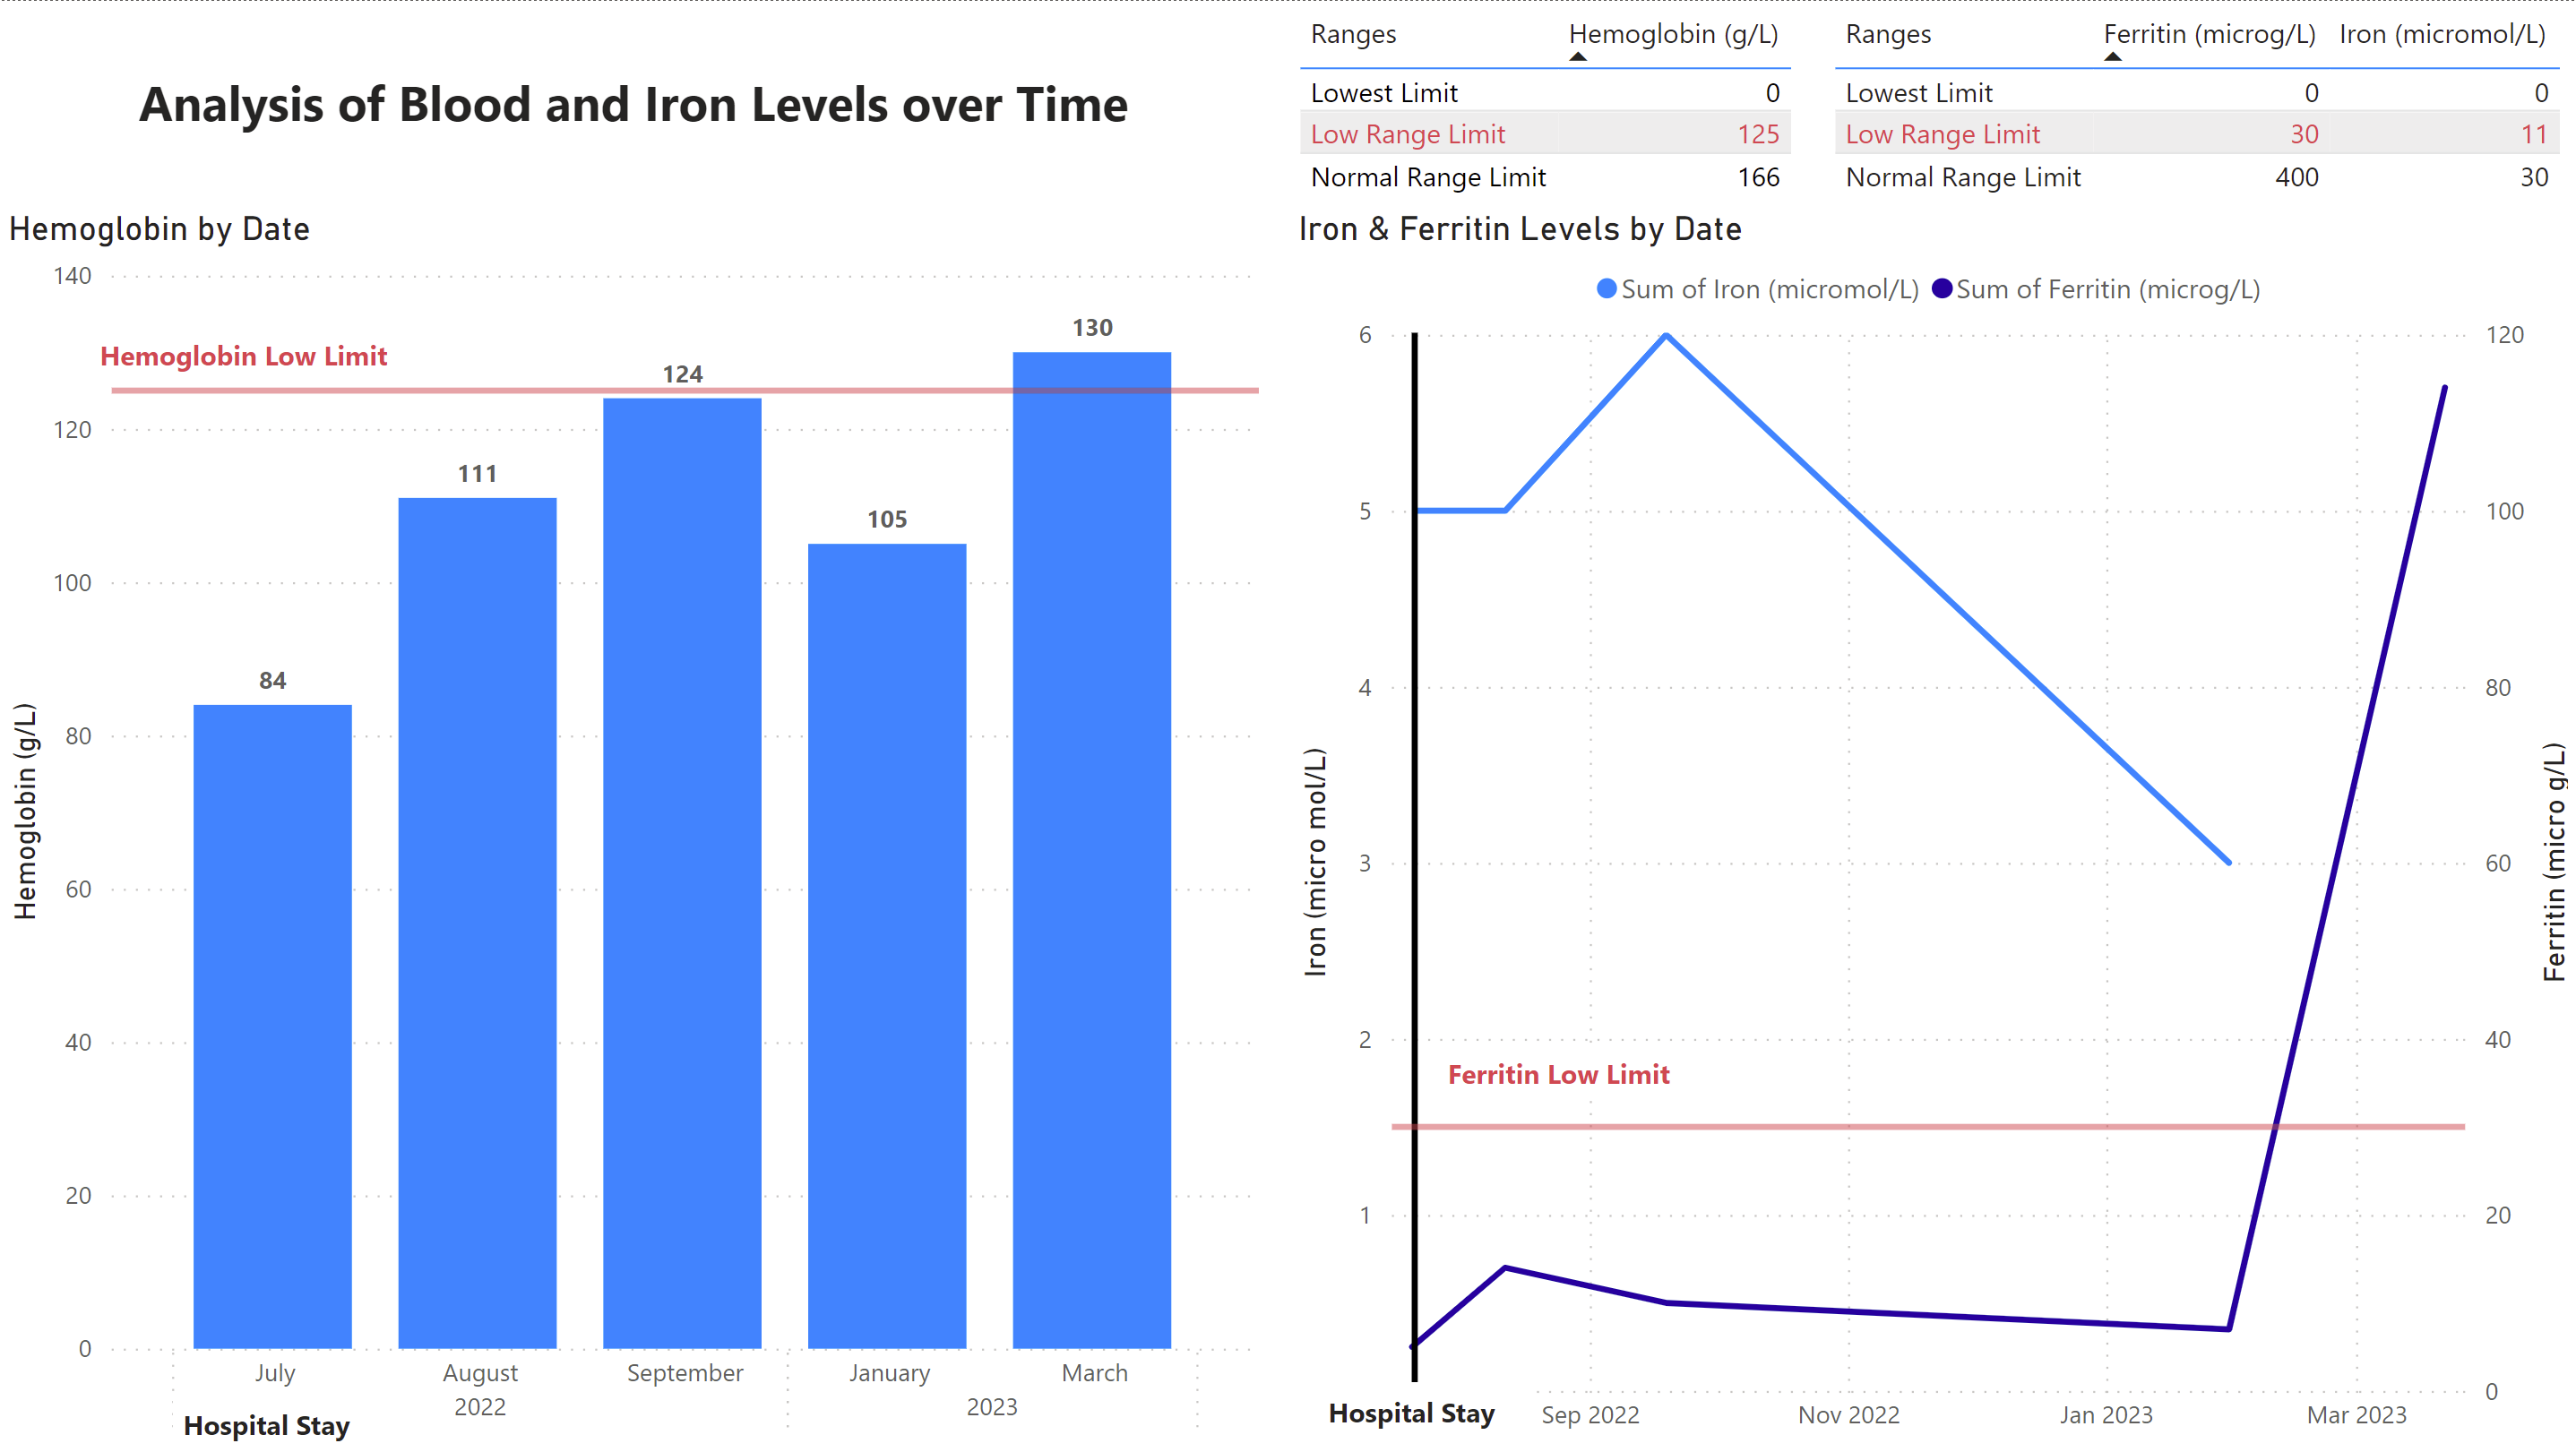
The result is a dashboard that I've put together which gives you a good sense of my progress over time.
Unfortunately, I don't have a Power BI license, so I can't share the actual Power BI file, but I am linking a picture of the dashboard, which is fairly self-explanatory (though not in a medical sense).